Class Sordariomycetes O.E. Erikss. & Winka, Myconet 1, 10 (1997)
Index Fungorum number: IF 90350; MycoBank number: MB 90350; Facesoffungi number: FoF 14263
Sordariomycetes is an important class of ascomycetes, characterized by non-lichenized, flask-shaped fruiting bodies or less frequently cleistothecial ascomata and unitunicate asci (Zhang et al. 2006, Maharachchikumbura et al. 2016b), and can have a varied growth form and colonise diverse habitats (Hongsanan et al. 2017). It is the second largest class of Ascomycota (Hyde et al. 2013, Maharachchikumbura et al. 2015, 2016b). Sordariomycetes have a cosmopolitan distribution and can be found in almost all ecosystems (Pratibha et al. 2014, Jones et al. 2015). Some Sordariomycetes are phytopathogens causing leaf, stem, root and fruit diseases (e.g., Colletotrichum, Coniella, Diaporthe), while others are pathogenic to arthropods and mammals (e.g., Sporothrix, Fusarium). Some members are endophytes (e.g. Pestalotiopsis) (Maharachchikumbura et al. 2014b, Norphanphoun et al. 2019) and some are saprobes involved in decomposition and nutrient cycling (Chaetomium, Neurospora) (Zhang & Wang 2015). Some taxa are fungicolous (Sun et al. 2019) and several are opportunistic pathogens of humans (Gostinčar et al. 2018). Some taxa of Sordariomycetes are economically important as biocontrol agents (Harman et al. 2004, Hyde et al. 2019a) and some species produce a wide range of important secondary metabolites (Maharachchikumbura et al. 2016b).
The class Sordariomycetes was established by Eriksson & Winka (1997), and the first main attempts at classifying all genera of Sordariomycetes were by Barr (1983, 1990) and Eriksson & Hawksworth (1986, 1993). These early efforts relied solely on morphology to classify what were poorly understood taxa at the time. Classification of the sexual morphs of Sordariomycetes was continued by Lumbsch & Huhndorf (2007, 2010), which incorporated morphology and available phylogenies. Maharachchikumbura et al. (2015, 2016) were among the first to include the asexual and sexual states as well as partial molecular data in the classification of Sordariomycetes. Hongsanan et al. (2017) used divergence time to support various class orders and families.
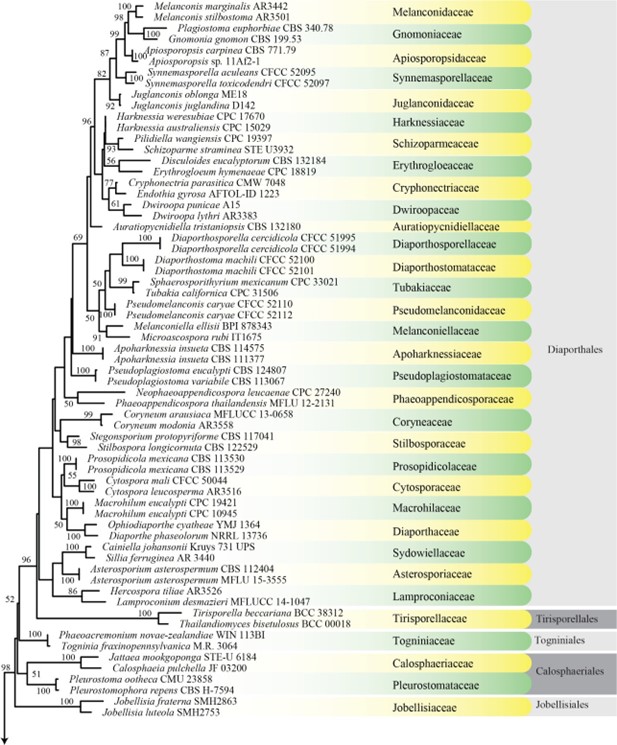
Figure 1 – Maximum likelihood (ML) majority rule combined LSU, SSU, tef1, and rpb2 consensus tree for the analyzed Sordariomycetes isolates. Families are indicated in yellow and green-colored blocks, and orders are indicated in dark and light gray-colored blocks. RAxML bootstrap support values (MLB above 50 %) are given at the nodes. The scale bar represents the expected number of changes per site. The tree is rooted with Botryotinia fuckeliana (AFTOL ID-59), Dothidea sambuci (DAOM 231303), and Pyxidiophora arvernensis (AFTOL-ID 2197).
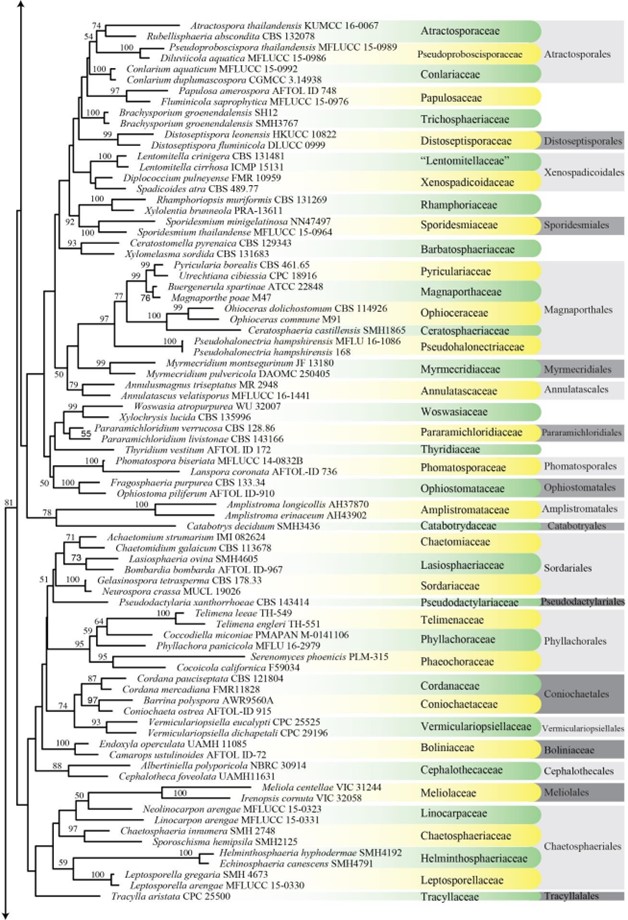
Figure 1 – Continued
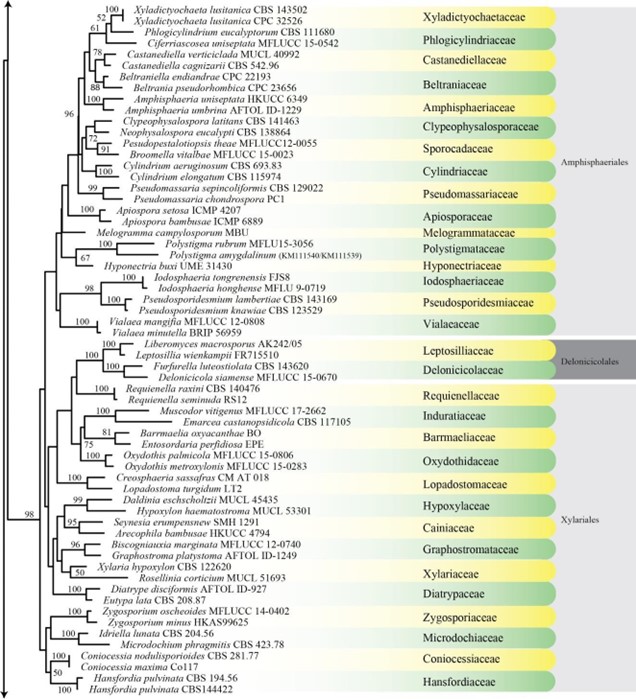
Figure 1 – Continued
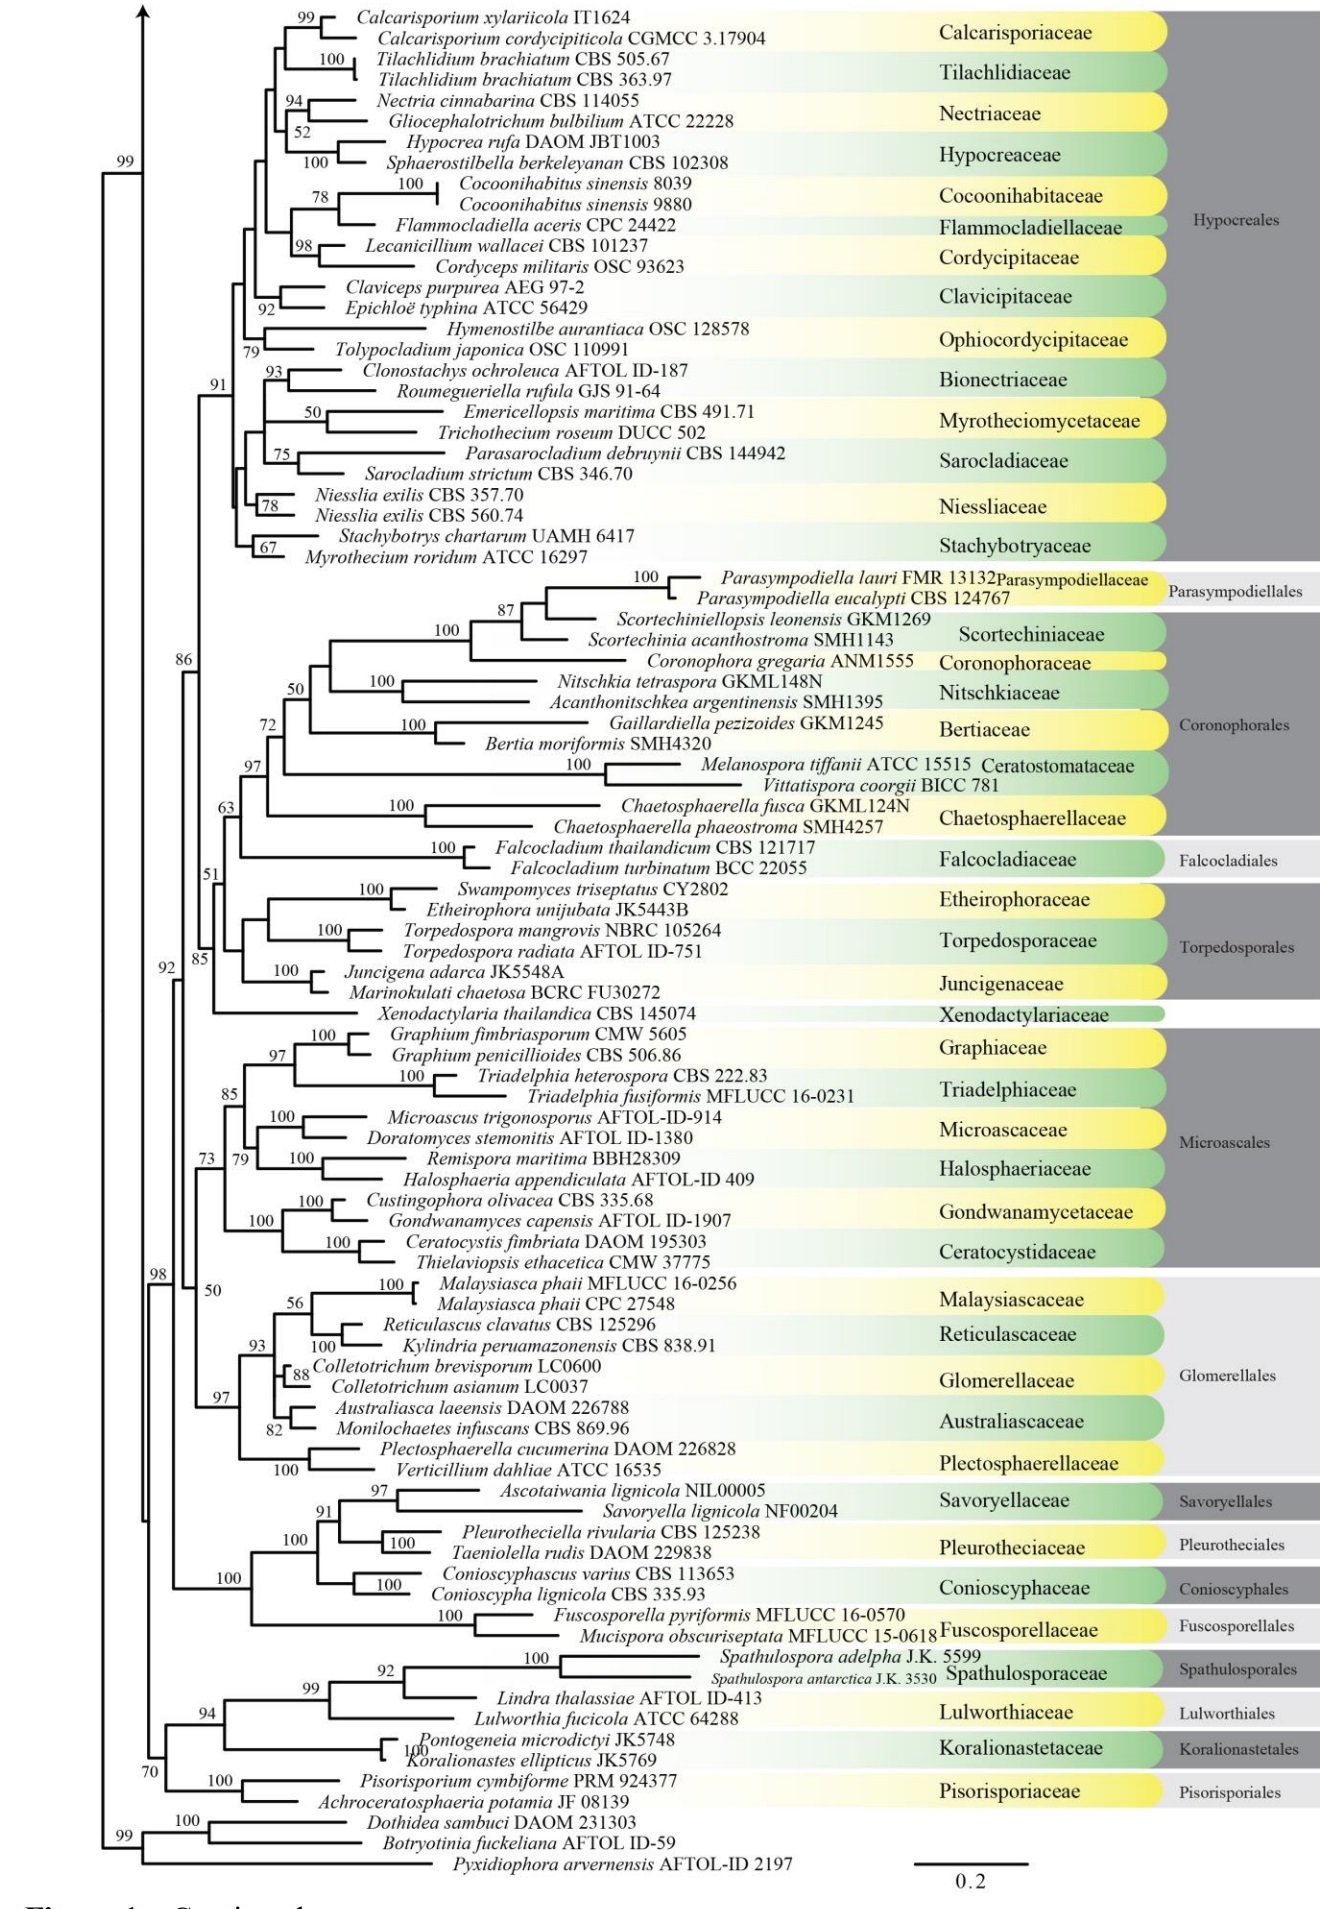
Figure 1 – Continued
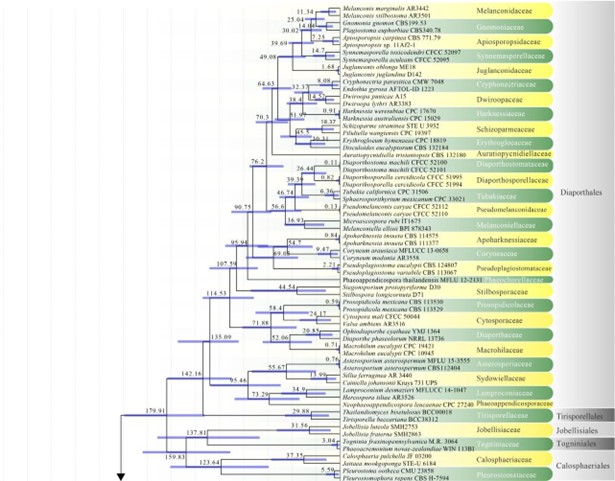
Figure 2 – The maximum clade credibility (MCC) tree, using the same dataset as Fig. 1. This analysis was performed in BEAST v1.10.2. The crown age of Sordariomycetes was set with Normal distribution, mean = 250, SD = 30, with 97.5% of CI = 308.8 MYA, and crown age of Dothideomycetes with Normal distribution mean = 360, SD = 20, with 97.5% of CI = 399 MYA. The substitution models were selected based on jModeltest2.1.1; GTR+I+G for LSU, rpb2 and SSU, and TrN+I+G for tef1 (the model TrN is not available in BEAUti 1.10.2, thus we used TN93). Lognormal distribution of rates was used during the analyses with an uncorrelated relaxed clock model. The Yule process tree prior was used to model the speciation of nodes in the topology with a randomly generated starting tree. The analyses were performed for 100 million generations, with sampling parameters every 10000 generations. The effective sample sizes were checked in Tracer v.1.6 and the acceptable values are higher than 200. The first 20% representing the burn-in phase were discarded and the remaining trees were combined in LogCombiner 1.10.2., summarized data and estimated in TreeAnnotator 1.10.2. Bars correspond to the 95% highest posterior density (HPD) intervals. The scale axis shows divergence times as millions of years ago (MYA).
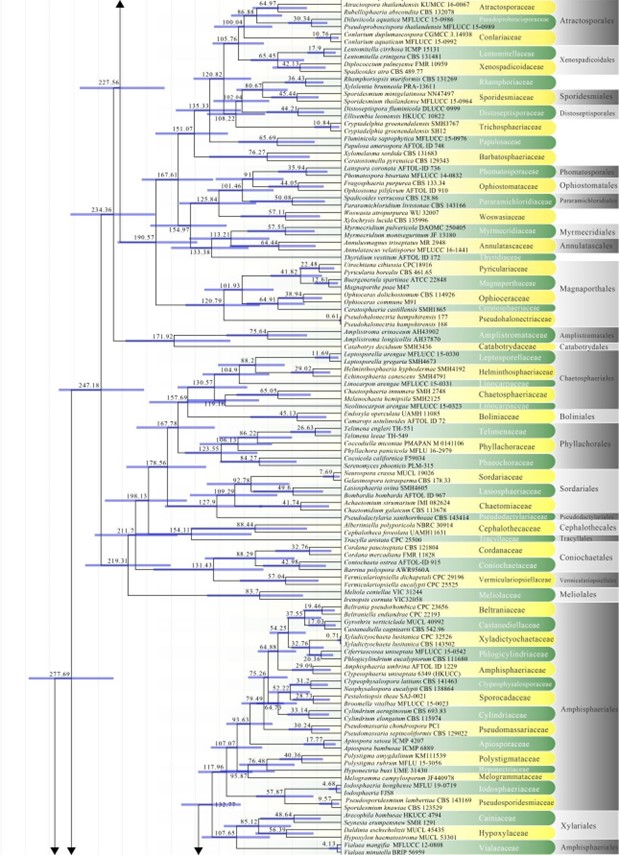
Figure 2 – Continued.
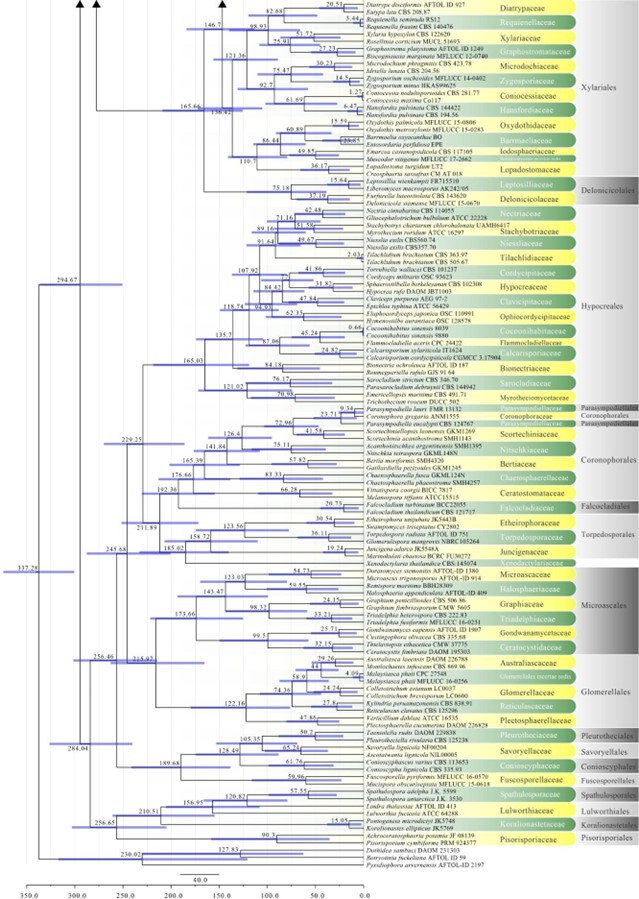
Figure 2 – Continued.
Subclasses