Solomyces Zhi.Y. Zhang, Y.F. Han and Z.Q. Liang, gen. nov.
MycoBank number: MB 835713; Index Fungorum number: IF 835713; Facesoffungi number: FoF 08688.
Etymology: Solo– (from Solum), in reference to its isolation from soil.
Saprobic on soil. Asexual morph: Conidia: terminal and lateral conidia borne on hyphae, short protrusions, or side branches. Conidia solitary, sometimes 2 in chains, pyriform, sometimes subglobose. Intercalary conidia abundant, olivary, subglobose to globose. Sexual morph: Unknown.
Geographical distribution: China and America.
Type species: Solomyces sinensis Zhi.Y. Zhang, Y.F. Han and Z.Q. Liang.
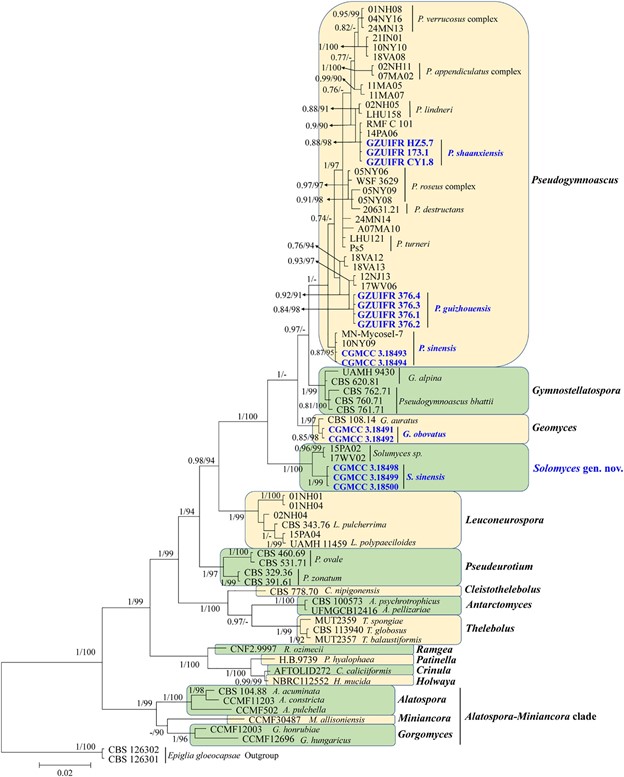
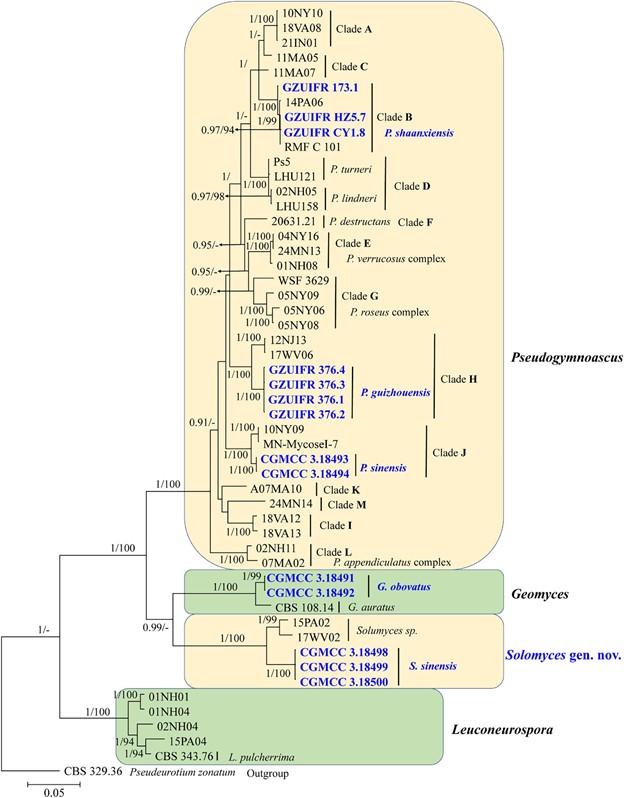
Notes: – Solomyces is introduced to accommodate Solomyces sinensis and another unnamed species (containing two strains, 15PA02 and 17WV02, from Hibernacular soil in Pennsylvania and West Virginia, respectively; Minnis and Lindner, 2013). The morphology of Solomyces species is similar to that of Geomyces and the asexual morphs of Pseudogymnoascus. However, Geomyces differ in having terminal and lateral conidia borne on hyphae, short protrusions or side branches; intercalary conidia barrel shaped, and conidiophores abundant, always forming verticillate and opposite branches with an acute angle to the axis near the apex (Van Oorschot, 1980; Chen et al., 2017). As can be seen in Figures 1, 2, strains of these genera appear in distinct clades in a phylogeny based on multiple strains, thereby justifying the erection of the new genus Solomyces.

FIGURE 1 | Phylogenetic relationships among the genera in Thelebolales based on Bayesian inference and maximum-likelihood analyses of the concatenated internal transcribed spacers (ITS) and LSU dataset. Posterior probabilities ≥0.7 and maximum-likelihood bootstrap values ≥90% are shown above the internal branches. The new isolates are presented in bold and blue.

FIGURE 2 | The consensus tree from the Bayesian inference and Geomyces and its allied genera based on the ITS, LSU, MCM7, RPB2, and EF1A concatenated dataset. Posterior probabilities ≥0.7 and maximum-likelihood bootstrap values ≥90% are shown above the internal branches. The new isolates are presented in bold and blue.
Species
