Neospermospora avenae (R. Sprague & Aar.G. Johnson) Crous & U. Braun, comb. nov.
MycoBank number: MB 838075; Index Fungorum number: IF 838075; Facesoffungi number: FoF 14075; Fig. 4.
Basionym: Pseudodiscosia avenae R. Sprague & Aar.G. Johnson, Mycologia 28(2): 183. 1936.
Synonym: Spermospora avenae (R. Sprague & Aar.G. Johnson) 430. Sprague, Diseases of Cereals and Grasses of North America: 430. 1950.
Typus: USA, Washington, Klichitat Co., High Prairie, on Avena sativa, 10 Feb. 1934, R. Sprague [lectotype, designated by Braun (1995: 238), K]; isolectotypes BPI 407544, 407549, CINC-F0008022, ISC-F-0098103, K, MICH 5608, NY01087070, OSC 8036, RMS 0024665, WIS-F-0033535. USA, Oregon, near Corvallis, on A. sativa, Mar. 1938, R. Sprague (epitype designated here CBS 227.38, MBT394907, preserved as a metabolically inactive culture; culture ex-epitype CBS 227.38 – reference strain deposited by R. Sprague).
Additional isolates examined: Australia, Victoria, Maryborough, on leaves of Avena sativa, 8 Sep. 2014, P. Zwer, VPRI 42798; Victoria, Wal Wal, on leaves of A. sativa, J. Edwards, 3 Oct. 2016, VPRI 42892a. Japan, H. Kurata, No. 4320, MUCL 8143 = CBS 388.64.
Description and illustration of characteristics in vivo: Braun (1995: 238 and 239, fig. 220).
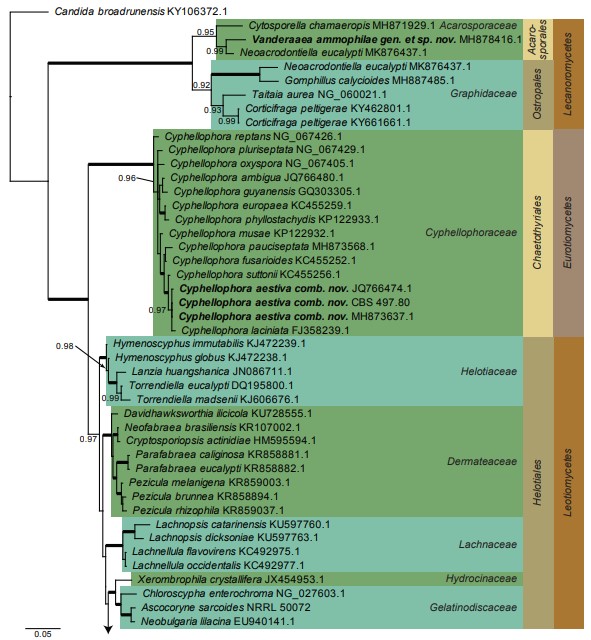
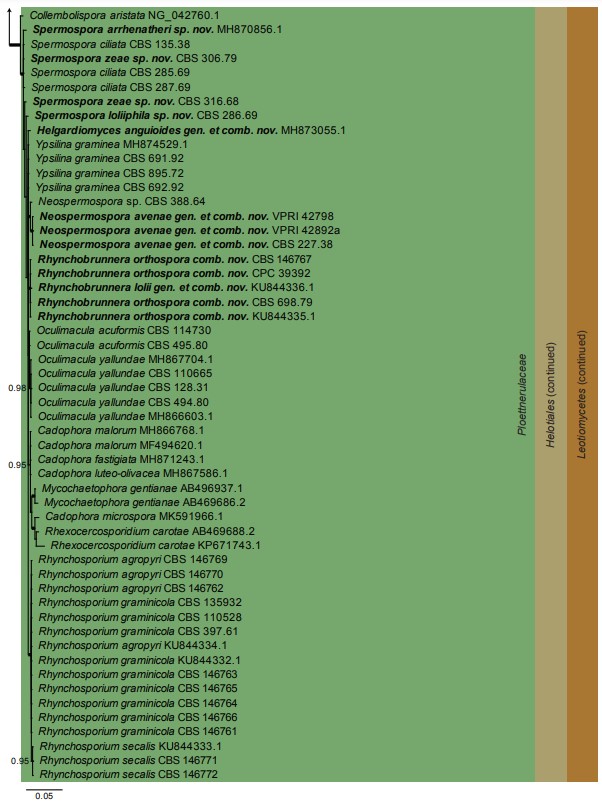
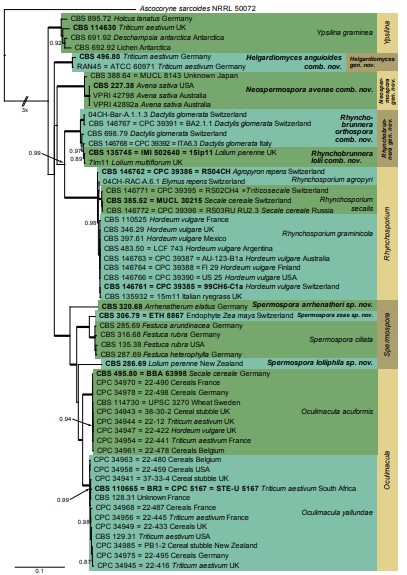
Notes: Neospermospora avenae causes red leather leaf disease of oats, reducing grain yield and hay quality, and has been reported from Europe, the USA, Turkey and Australia (Cunningham 1990, Zaveri et al. 2020). Based on the isolates included in the phylogeny, it appears that an undescribed species of Neospermospora (CBS 388.64) also occurs on Avena in Japan. This isolate is genetically slightly different from the other included cultures of N. avenae with the following number of substitutions compared to the other sequenced strains: three (and one indel) in ITS, seven in LSU, 10 in act, two in rpb1, 11 in rpb2, and 17 substitutions in tef1. Cultures of N. avenae formed a microconidial synanamorph in culture with hyaline, aseptate conidia. The species formed a fully supported lineage in all analyses of different combinations of the six loci studied here (Figs 1, 2, S1–S9). Sprague & Johnson (1936) failed to designate a holotype for Pseudodiscosia avenae. They only cited several “co-types” which required lectotypification (Braun 1995). That is followed here for designating an epitype obtained from a living culture that served as the source of the sequence data.
Fig. S1. Consensus phylogram (50 % majority rule) resulting from a Bayesian analysis of the ITS sequence alignment of sequences generated in this study and reference sequences from NCBI GenBank. Bayesian posterior probabilities (PP) > 0.85 are shown at the nodes and thickened lines represent nodes with PP = 1.00. The scale bar represents the expected changes per site. Species and culture collection numbers are indicated. The tree was rooted to Ascocoryne sarcoides (culture NRRL 50072).
Fig. S2. Consensus phylogram (50 % majority rule) resulting from a Bayesian analysis of the LSU sequence alignment of sequences generated in this study and reference sequences from NCBI GenBank. Bayesian posterior probabilities (PP) > 0.85 are shown at the nodes and thickened lines represent nodes with PP = 1.00. The scale bar represents the expected changes per site. Species and culture collection numbers are indicated. The tree was rooted to Ascocoryne sarcoides (culture NRRL 50072).
Fig. S3. Consensus phylogram (50 % majority rule) resulting from a Bayesian analysis of the act sequence alignment of sequences generated in this study and reference sequences from NCBI GenBank. Bayesian posterior probabilities (PP) > 0.85 are shown at the nodes and thickened lines represent nodes with PP = 1.00. The scale bar represents the expected changes per site. Species and culture collection numbers are indicated. The tree was rooted to Ascocoryne sarcoides (culture NRRL 50072).
Fig. S4. Consensus phylogram (50 % majority rule) resulting from a Bayesian analysis of the rpb1 sequence alignment of sequences generated in this study and reference sequences from NCBI GenBank. Bayesian posterior probabilities (PP) > 0.85 are shown at the nodes and thickened lines represent nodes with PP = 1.00. The scale bar represents the expected changes per site. Species and culture collection numbers are indicated. The tree was rooted to Ascocoryne sarcoides (culture NRRL 50072).
Fig. S5. Consensus phylogram (50 % majority rule) resulting from a Bayesian analysis of the rpb2 sequence alignment of sequences generated in this study and reference sequences from NCBI GenBank. Bayesian posterior probabilities (PP) > 0.85 are shown at the nodes and thickened lines represent nodes with PP = 1.00. The scale bar represents the expected changes per site. Species and culture collection numbers are indicated. The tree was rooted to Ascocoryne sarcoides (culture NRRL 50072).
Fig. S6. Consensus phylogram (50 % majority rule) resulting from a Bayesian analysis of the tef1 sequence alignment of sequences generated in this study and reference sequences from NCBI GenBank. Bayesian posterior probabilities (PP) > 0.85 are shown at the nodes and thickened lines represent nodes with PP = 1.00. The scale bar represents the expected changes per site. Species and culture collection numbers are indicated. The tree was rooted to Ascocoryne sarcoides (culture NRRL 50072).
Fig. S7. Consensus phylogram (50 % majority rule) resulting from a Bayesian analysis of the full set 6-gene (ITS, LSU, act, tef1, rpb1, rpb2) sequence alignment. Bayesian posterior probabilities (PP) > 0.85 are shown at the nodes and thickened lines represent nodes with PP =
1.00. The scale bar represents the expected changes per site. Species and culture collection numbers are indicated. The tree was rooted to Ascocoryne sarcoides (culture NRRL 50072).
Fig. S8. Consensus phylogram (50 % majority rule) resulting from a Bayesian analysis of the full set 4-gene (ITS, LSU, act, tef1) sequence alignment. Bayesian posterior probabilities (PP) > 0.85 are shown at the nodes and thickened lines represent nodes with PP = 1.00. The scale bar represents the expected changes per site. Species and culture collection numbers are indicated. The tree was rooted to Ascocoryne sarcoides (culture NRRL 50072).
Fig. S9. Consensus phylogram (50 % majority rule) resulting from a Bayesian analysis of the full set 2-gene (rpb1, rpb2) sequence alignment. Bayesian posterior probabilities (PP) > 0.85 are shown at the nodes and thickened lines represent nodes with PP = 1.00. The scale bar represents the expected changes per site. Species and culture collection numbers are indicated. The tree was rooted to Ascocoryne sarcoides (culture NRRL 50072).

Fig. 1. Consensus phylogram (50 % majority rule) resulting from a Bayesian analysis of the LSU sequence alignment. Bayesian posterior probabilities (PP) > 0.89 are shown at the nodes and thickened lines represent nodes with PP = 1.00. The scale bar represents the expected changes per site. Families, orders and classes are indicated with coloured blocks to the right of the tree. GenBank accession and/or culture collection numbers are indicated behind the species names. The tree was rooted to Candida broadrunensis (GenBank KY106372.1) and the taxonomic novelties described in this study are indicated in bold face.

Fig. 1. (Continued)

Fig. 2. Consensus phylogram (50 % majority rule) resulting from a Bayesian analysis of the reduced set 6-gene (ITS, LSU, act, tef1, rpb1, rpb2) sequence alignment. Bayesian posterior probabilities (PP) > 0.85 are shown at the nodes and thickened lines represent nodes with PP = 1.00. The scale bar represents the expected changes per site. Species and genera are indicated with coloured blocks to the right of the tree. Culture collection numbers are followed by the host and country of origin where known. The tree was rooted to Ascocoryne sarcoides (culture NRRL 50072) and the taxonomic novelties described in this study and cultures with a type status are indicated in bold face.

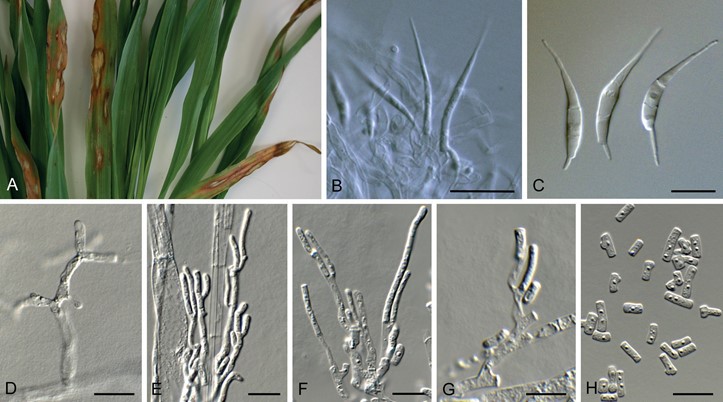
Fig. 4. Neospermospora avenae. A–C (VPRI 42798). Disease symptoms on Avena sativa. B. Conidiogenous cells giving rise to macroconidia.
- Macroconidia. D–H (CBS 227.38). Hyphae giving rise to a microconidial synasexual morph. Scale bars = 10 µm.
