Diplodia torilicola Harishchandra, Camporesi, A.J.L. Phillips & K.D. Hyde, sp. nov.
Index Fungorum number: IF 556364; MycoBank number: MB 56364; Facesoffungi number: FoF 05980; Fig. 1
Etymology – Name reflects the host genus Torlilis
Holotype – JZBH3140012.
Saprobic on dead aerial stem of Torilis arvensis. Sexual morph: Undetermined. Asexual morph: Coelomycetous. Conidiomata on host 99–160 µm diam (x̅ = 128 µm, n = 10) pycnidial, solitary, scattered, globose, black, semiimmersed to immersed. Ostiole single, centrally located. Conidiomata wall 30–40 µm wide ( x̅ = 34 μm, n = 10) at both sides, multi-layered, brown to black cells of textura angularis. Conidiophores not observed. Conidiogenous cells cylindrical, thin-walled, hyaline 16–25 μm high × 3–9 μm wide ( x̅ = 16.8 × 4.6 μm, n = 20) producing a single conidium at the apex. Conidia 17–22 μm long × 8–11 μm wide ( x̅ = 21 × 8.8 μm, n = 40), initially hyaline soon becoming pigmented, dark brown when mature, aseptate, ellipsoid to ovoid with central guttules.
Culture characteristics – Colonies on PDA attaining 90 mm diam within 3 days at 25 °C, with white moderately aerial mycelium and white in reverse. Mycelia becoming dense, cottony and black with age.
Material examined – ITALY, near Castrocaro Terme in Forlì-Cesena Province, on dead aerial stem of Torilis arvensis, 11 December 2017, Erio Camporesi, JZBH3140012 (holotype).
GenBank numbers – ITS: MK625223; TEF1: MK640502.
Notes – Diplodia torilicola is most closely related to D. crataegicola but forms a well-supported independent lineage from it (Fig. 2). It differs by possessing larger conidia that are ellipsoid to ovoid (21 × 8.8 µm) whereas D. crataegicola has smaller (14 × 9 µm) globose to subglobose conidia (Ariyawansa et al. 2015). This is the first report of a Diplodia species on Torilis arvensis (Farr and Rossman 2019)
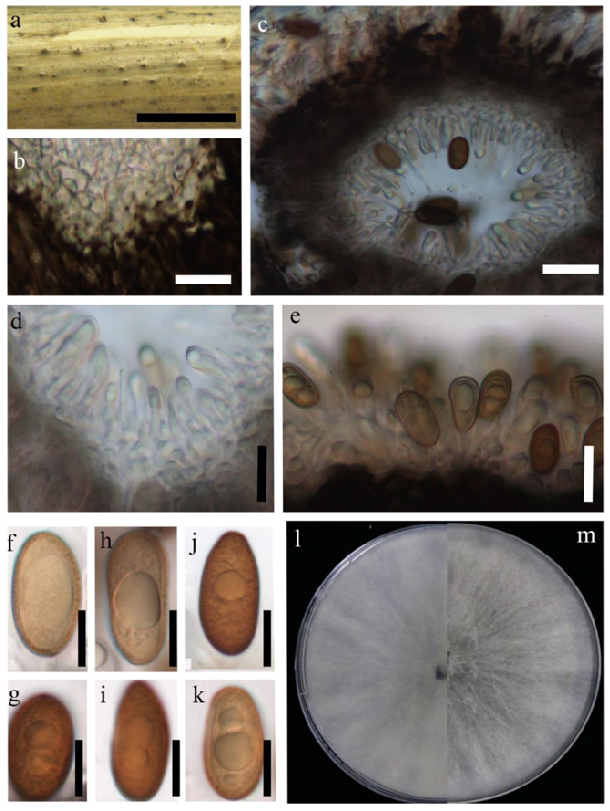
Figure 1 – Diplodia torilicola (JZB3140012, holotype). a Conidiomata on the host tissue. b Section of the pycnidial wall. c Cross section of conidiomata on host. d–e Conidiogenous cells. f–k Conidia. l Lower view of 7-day old culture. m Upper view of 7-day old culture. Scale bars: a = 1000 μm, b–e = 20 μm, f–k = 10 μm
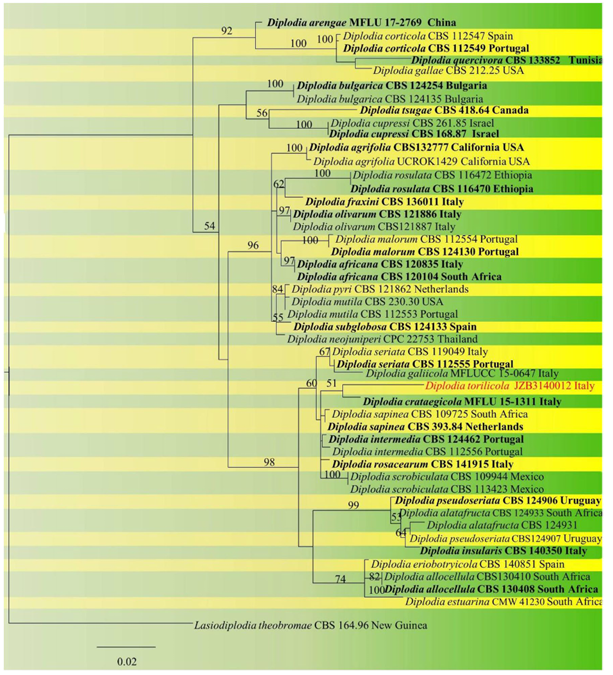
Figure 2 – Phylogram generated from maximum likelihood analysis of combined ITS and TEF1 sequence data. Bootstrap support values ≥ 50% are given above each branch respectively