Ascochyta herbicola (Wehm.) Qian Chen & L. Cai, Stud. Mycol. 82: 187 (2015)
= Ascochyta rosae Tibpromma, Camporesi & K.D. Hyde, in Tibpromma et al., Fungal Diversity 83: 74 (2017)
Index Fungorum number: IF 814127, Facesoffungi number: FoF 07122, Fig. 1
Saprobic on the host plant in terrestrial habit. Sexual morph: see Tibpromma et al. (2017). Asexual morph: Conidiomata 190–240 μm diam., 110–230 μm high, brown, pycnidial, scattered, rarely gregarious, semi-immersed to superficial, globose to subglobose, unilocular, thick-walled, glabrous. Ostiole absent, dehiscing by an irregular rupture in the apical wall. Conidiomatal wall 20–50 μm wide, composed of relatively thick-walled, dark brown to brown cells of textura angularis in the basal part from exterior to conidial hymenium, becoming thinner in the upper part. Conidiophores mostly reduced to conidiogenous cells, occasionally present, short, cylindrical, septate and branched at the base, formed from inner layers of peridium. Conidiogenous cells 6–13 × 2–4 μm, hyaline, enteroblastic, annellidic, lageniform, attenuated towards the apex, discrete or integrated, indeterminate, smooth-walled. Conidia 4–7 × 1.5–2.6 μm ( ̄x = 5 × 2 μm; n = 50), hyaline, cylindrical to subcylindrical, rounded at both ends, straight or slightly curved, unicellular, thick- and smooth-walled.
Material examined – Russia, 20th anniversary of Red Army microdistrict, on dead stems of Potentilla sp. (Rosaceae), 21 May 2015, T.S. Bulgakov, T422 (MFLU 15-2126).
Notes – A new specimen (MFLU 15-2126) collected on Potentilla sp. in Russia nested between A. rosae (MFLUCC 15-0063) and A. herbicola (CBS 629.97) (Fig. 32). The sequence (LSU, ITS and rpb2) of the new collection are compared with A. rosae and A. herbicola, and the results showed only three loci (including two gaps) difference between the new collection and A. rosae in rpb2 except at the beginning and end, and also three loci difference between new collection and A. herbicola. In addition, our collection has similar conidia with A. herbicola (5–7(–8.5) × 2–3 μm, av. 6.2 × 2.3 μm (Degruyter et al. 1993). Thus, we treat these three collections as conspecific, and synonymize A. rosae under A. herbicola.
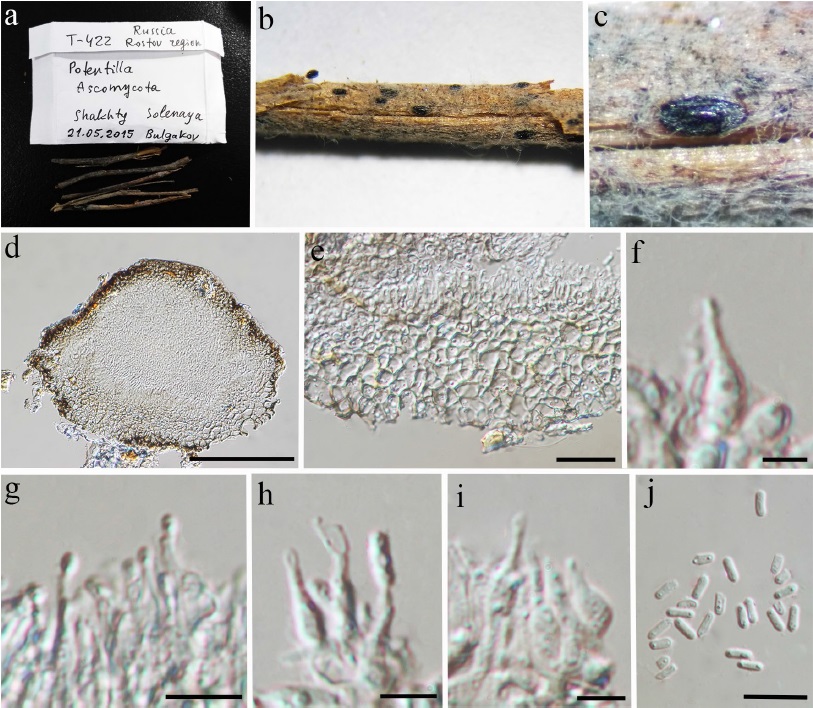
Fig. 1. Ascochyta herbicola (MFLU 15-2126). a Herbarium package and specimen. b–c Appearance of black conidiomata on the host. d Vertical section of conidioma. e Section of peridium. f–i Conidiogenous cells and developing conidia. j Conidia. Scale bars: d = 100 μm, e = 20 μm, f–j = 5 μm.
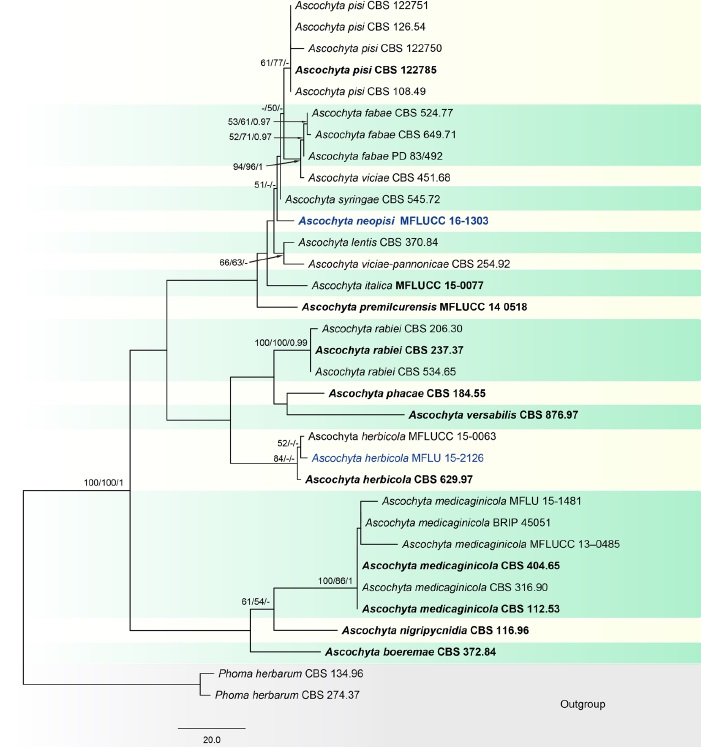
Fig. 1. Phylogenetic tree generated from a maximum parsimony analysis based on a concatenated alignment of ITS, LSU, rpb2 and tub2 sequences data representing Ascochyta. The newly generated nucleotide sequences were compared against the GenBank database by blast search. Related sequences were obtained from Chen et al. (2015), Tibpromma et al. (2017) and GenBank. Thirty-three strains are included in the analyses, which comprise 2273 characters including gaps (ITS: 1–489, LSU: 490–1344, rpb2: 1345–1940, tub2: 1941–2273). Phoma herbarum CBS 134.96 and P. herbarum CBS 274.37 are used as the outgroup taxa. The tree topology of the maximum likelihood analysis is similar to either the maximum parsimony or the Bayesian analysis. The best-scoring RAxML tree with a final optimization likelihood value of − 5657.513625 is presented. The matrix had 270 distinct alignment patterns, with 16.63% of undetermined characters or gaps. Estimated base frequencies were: A = 0.242420, C = 0.238519, G = 0.274514, T = 0.244547; substitution rates AC = 0.891880, AG = 4.215502, AT = 1.884133, CG = 0.651574, CT = 11.712755, GT = 1.000000; gamma distribution shape parameter α = 0.020000. The maximum parsimonious dataset consisted of constant 1979, 216 parsimony-informative and 78 parsimony-uninformative characters. The parsimony analysis of the data matrix resulted in the maximum of two equally most parsimonious trees with a length of 439 steps (CI = 0.749, RI = 0.864, RC = 0.647, HI = 0.251) in the first tree. Maximum parsimony (MPBS) and maximum likelihood (MLBS) bootstrap support values higher than 50%, and Bayesian posterior probabilities ≥ 0.95 (PP) are shown above or below the nodes, respectively. Hyphen (“–”) indicates a value lower than 50% for MPBS and MLBS and a posterior probability lower than 0.95 for BYY. The scale bar indicates 20.0 changes. Ex-type and reference strains are in bold. New isolates are shown in bold and highlighted with colour